Paraview visualization filter
This page describes how to use the brain visualization filter inside Paraview:
- the plugin acts on a mesh of point representing the surface of the brain
- several visualization algorithm and parameters are shown in the user interface
- the plugin needs external files in order to render the connectivity edges
Input data
For the plugin to compute the visualization, the following elements are required:
- the mesh on which computation will be performed. This is usually a mesh file that Paraview can understand/load without extra requirements,
- the connectivity (or edges) file that contains the topology of connection network in the brain.
This connectivity file is a mapping between pair of mesh or volume location and a weight.
In its current form, it is a python
numpyfile that is generated with a command line tool form the brain connectivity package, and that is described in the section Connectivity file from Nifti. - Optionally it is also possible to provide a preprocessed clusters file, which would avoid the live computation of the clustering for the selected edges. See section Clustering for more details.
Parameters
The parameters exposed to the user by the plugin are shown in the picture below:
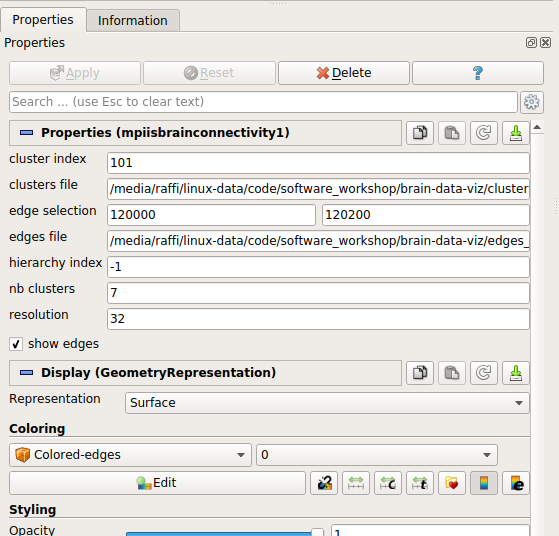
The meaning of the parameters are:
resolution: indicates the edges resolution, ie. the number of intermediate steps a path connecting two sites is divided into. The higher this number, the smoother the trajectory but also the heavier the on-screen drawing,edge selection: a range of edge indices on which the processing will be performed. Any edge falling outside of this range is ignored in the visualization and the computation. This entry is ignored when a cluster file is provided.edge file: the absolute path of the file containing the definition of the topology,show edges: if checked, the edges will be shownclusters file: the absolute path to the file containing the results of the clustering. This file contains a preprocessed version of the clustering. If not present, a clustering of the selected edges will be computed during the visualization, which may take some time. For offline computation of the clustering, see the corresponding section.nb_clusters: indicates the number of desired clusters. This applies on the range of edges that has been selected or the full range if no selection has been made, and is ignored if theclustering fileis given.cluster index: if given, a specific cluster to show on screen. All other clusters are discarded. The edges that are in the specified cluster are also shown.hierarchy index: the level of the hierarchy to which the cluster index applies.
Note
The hierarchical part is not functional.