Computation utilities
Along the Paraview plugin, several functions have been developed. Those utilities have different purposes:
- make off-line computations in order to speed-up the visualization
- support the writing of new visualization functions
Visualization preparation
The visualization requires a little preparation step that aims at creating necessary or optional files. Those files are either required for the visualization, or assist the visualization with additional elements.
The only necessary file is the edge file that indicates the plugin the end-points of the different connectivity edges in the 3d volume.
Additionally, it is possible to create:
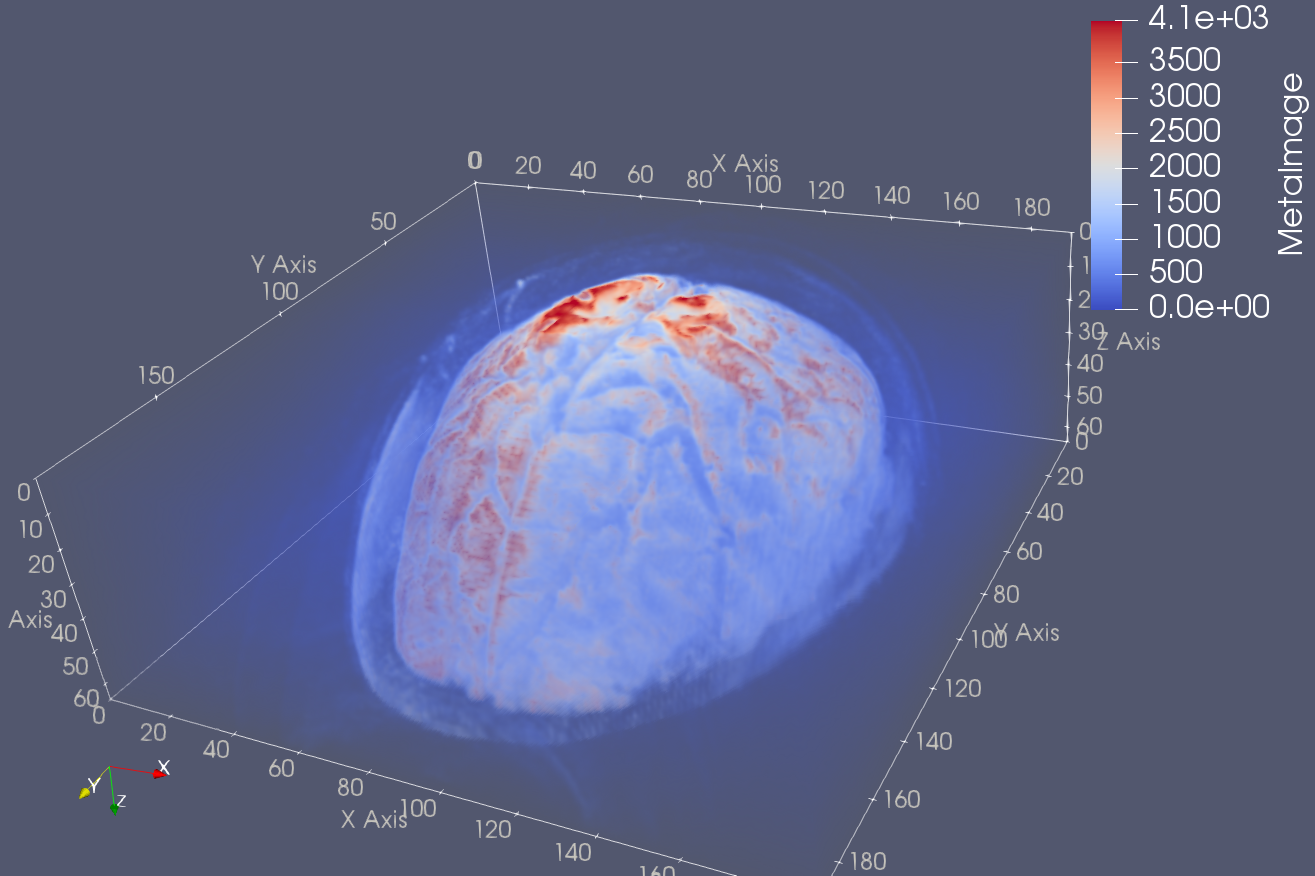
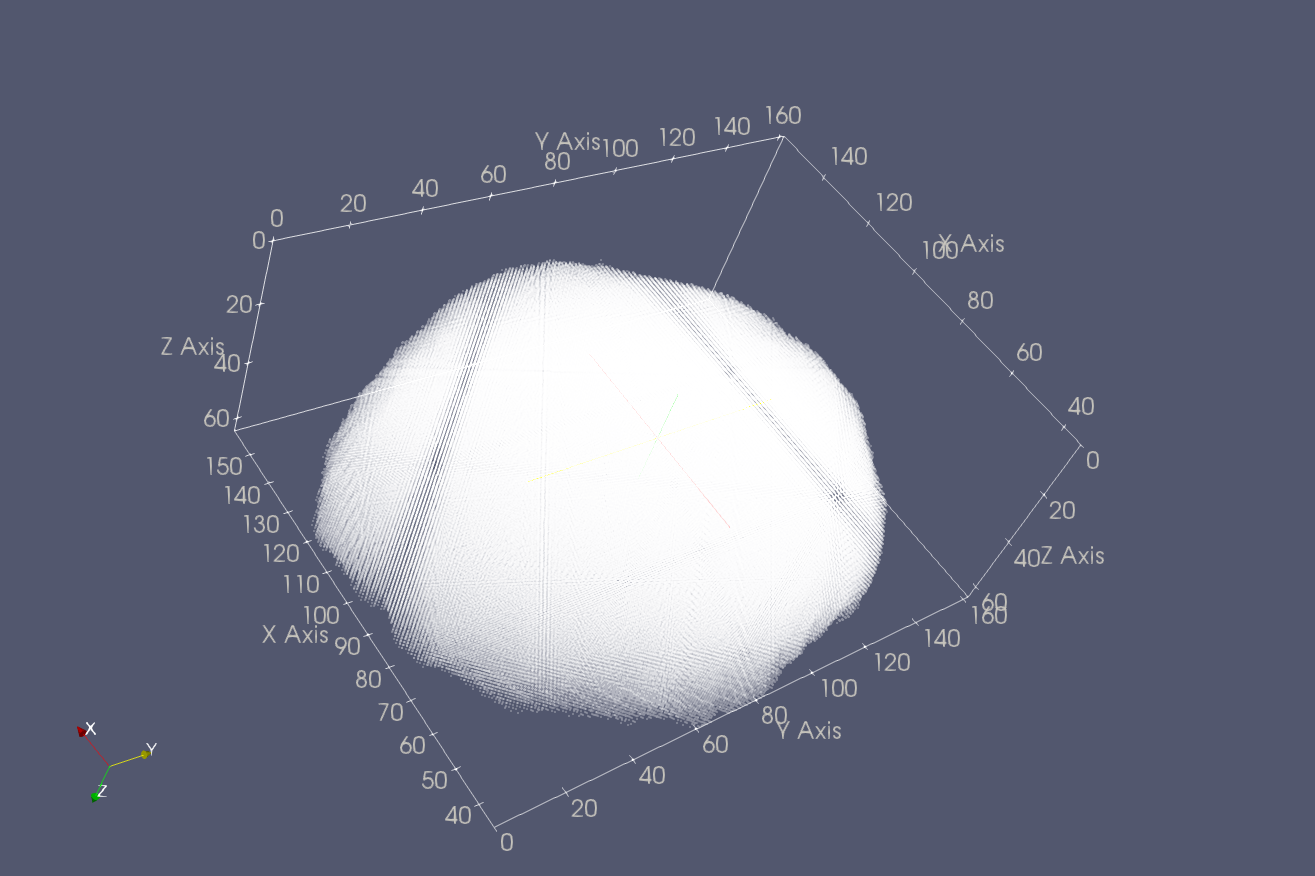
a volume file from a nifti volumetric data. An example of use of such a file in Paraview is given in the image below
a grid file of all edges end-points location.
Off-line computations
Clustering with kMeans
The clustering of edges is performed with the kmeans algorithm.
The version of this algorithm currently being in use within the plugin is implemented in a naive way in Python, using a distance function that is specific to the needs of the visualization. Accelerated algorithms exist such as the [Elkan] and that involves a lower number of computations and distance evaluations.
The hierarchical version of the kMeans runs the kMeans at each level of the hierarchy, and has also a complexity similar to the kMeans multiplied by the number of hierarchy levels.
Since the clustering may take some time to converge, a script accessible after the installation of the package in a virtual environment is provided.
Bibliographic references
| [Elkan] | Elkan: Using the triangle inequality to accelerate k-means, ICML‘03 |
References
mpi_is_sw.brain_connectivity.naive_k_means
This module defines the k-means clustering used for creating clusters of edges and summarized information for the set of edges. The implementation is pure python and is slow, hence the name naive.
-
convergent(old_means, new_means)¶ Returns
Trueif the two sets of edges are close enough.This would indicate that the convergence of the k-means clustering has been reached.
-
create_flip_map(distances)¶ Compares two arrays column-wise and returns an array of integer indices denoting whether the first or second array contains the smaller value.
Parameters: distances – a matrix of shape (2, k, n) where k is the number of means and n is the number of edges each mean is compared to Returns: an array of integer values of 0, 1
-
distances(edges, means)¶ Computes the distance between two set of edges.
The distance is summing the distance between the end points of two edges, irrespective of the orientation of those edges.
The fixed set is called
means. For each edge returns the index of the closest mean edge, as well as a boolean value marking whether or not edge_i has been closer to the flipped or original version of the mean in question.
-
fetch_edges(mean_index, edges, means)¶ Returns a matrix containing all edges assigned to a mean_index.
-
init_centroids(k, edges)¶ Returns k centroids by randomly sampling data points out of a given set of edges, as a matrix of shape (k, n).
Parameters: - k – an integer value denoting the number of means/clusters.
- edges – a matrix of edges to sample the initial means from
Returns: a matrix of k data points from the original edges matrix
Raises: AssertErrorifk > edges.shape[0]
-
kmeans(k, edges, max_iterations=100, verbose=False, callback=None)¶ Returns k-means clustering of a set of edges.
This algorithm clusters the set of
edgesinkclusters, using the metric given by thedistance()function.Parameters: - k – an integer value denoting the number of means/clusters
- edges – a matrix of n-dimensional datapoints
- max_iterations – an integer value that defines the maximum number of iterations should convergence not be reached
- callback – a callable object taking two arguments: the centroids and the labels. The callback is called every 100 iterations and may be used for checkpointing.
Returns: a 2-uples where the first element is a matrix of shape
(k, n)containing the centroids/means of the clustered dataset, and the second element of the tuple being the assignments/labels of theedgesgiven as argument to the indexed centroids.
-
label_elements(distances)
-
reorder_edges(edges, flip_map)¶ Combines an array
edgesof datapoints and its flipped copy into a single array with length equal to the length of the originaledges. Datapoints are chosen based on a boolean arrayflip_map.Parameters: - edges – a matrix of shape (n, 6)
- flip_map – an integer/boolean array of length n
Returns: a matrix of shape (n, 6)
-
update_centroids(edges, labels, means, flip_map)¶ Returns an updated matrix of means. For each mean, sets it to the mean of all points assigned to it.
Parameters: - edges – a matrix of n-dimensional edges to compute clusters of
- labels – a matrix of shape edges.shape with integer values in the half-open interval [0, k)
- means – a matrix of shape (k, 1, n) where k is the number of datapoints and n is the length of a single datapoint
Returns: a matrix of shape (k, 1, n), containing the updated means